In our team, we believe in forecasts via Monte Carlo Simulations over expert estimates. As in our experience, using estimates often felt like coming up with magic numbers to guess how long something will take. It took time, it was rarely accurate (it’s an estimate after all) and it might have put pressure on the team to “deliver” exactly on the estimate.
Simultaneously, we sought to assess the precision of our forecasts derived from Monte Carlo simulations. Are they accurate at all? In adherence to the principles of inspection and adaptation, we conducted an analysis to evaluate the accuracy of Monte Carlo forecasts. Subsequently, we improved our approach to enhance accuracy in scenarios involving a significant influx of unplanned work (in our case, bugs).

Image Source: Freepik
We are Lorenzo (Product Owner), and Benji (Scrum Master), and have been using MC simulations for a while with our teams at Hitachi Energy.
In this case study, we analyze the forecasts created using Monte Carlo simulations over the period of roughly a month. The analysis happened in the spring of 2023 and was initially only used internally.
We decided to publish it online available to everyone, so that others might also profit and learn. Expert estimates, for example using Story Points, are still prevalent in many organizations (including parts of our own). We hope that the data we provide here encourages more people to challenge this approach and explore other available options. Feel free to reach out to us if you would like to learn more.
Product Context
Our product isn’t a cloud service. It’s installed on-premise, and many customers don’t want to update it often, as it runs as part of critical infrastructure. This is why we are releasing in bigger batches, every couple of months. To schedule those releases (and potentially sync them with other products delivered to customers) it’s important to know when some features will be done or how many things we can manage till a target date.
That’s why we‘ve started using Monte Carlo Simulations.

Sometimes our products actually need to go on a ship to be delivered — Source: Freepik
The product has quite a history and also some issues with technical debt. Some parts of the code are not yet in good shape and are prone to bugs when something is changed. Thus we struggle with the number of things we break while we develop new features in certain areas. Furthermore, we continue to encounter instances of ‘newly found bugs’ in areas that have not undergone recent modifications, revealing latent issues that had remained undiscovered for an extended period. We are aware that this is not ideal, and if we could, we’d try to fix every defect before we release. But it will take some time to improve this situation. And if we have 100 defects, it’s still worth to release a new version that only has 90 defects, as it will solve at least some of our customers problems.
Gathering Data
Back in March, we planned the next release supported by Monte Carlo simulation to “define” the release date. It should include some new features as well as some bug fixes. The following is the timeline of how we progressed toward the release with data from our Monte Carlo forecasts.
How it Started
As of March 22nd, we had 29 pending backlog items for our upcoming release. This was a mix of feature-related items as well as bug fixes.
The Monte Carlo Simulation forecasted the completion of the 29 items by April 9th.
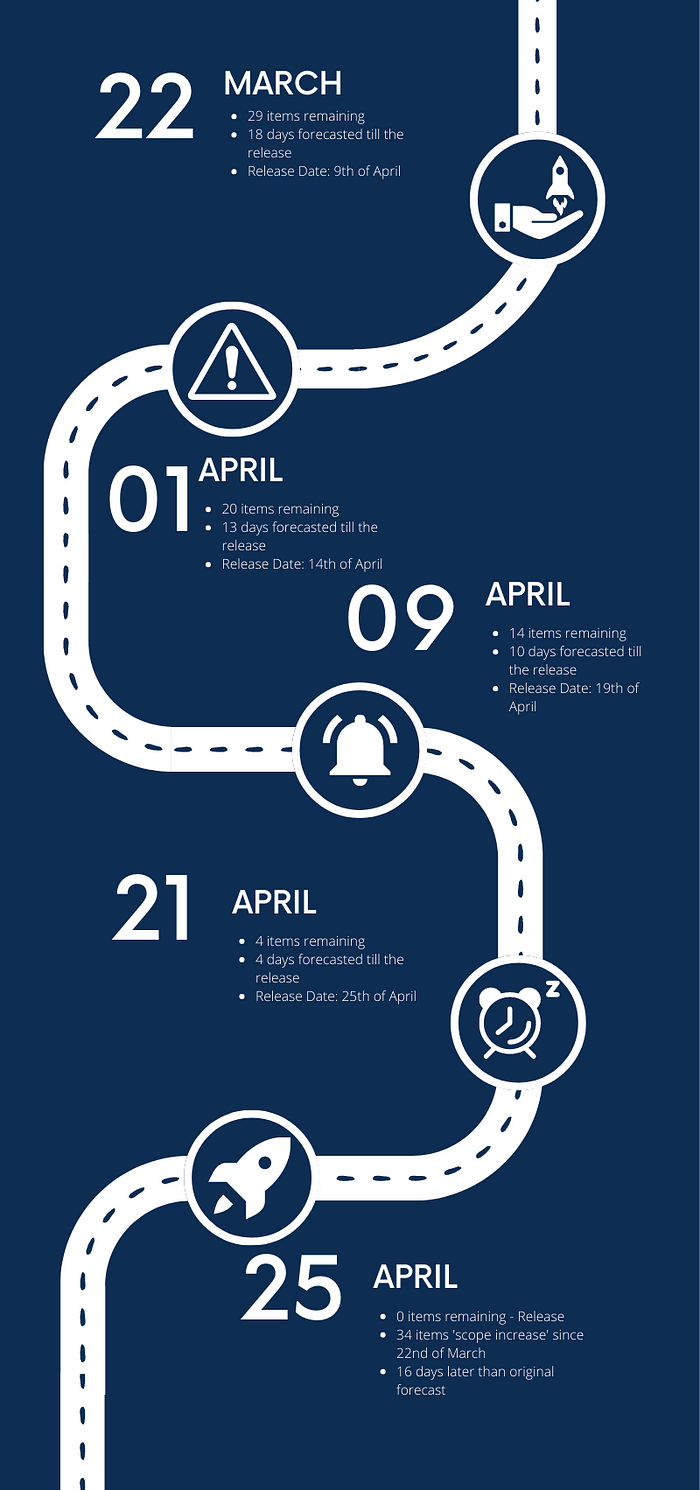
Release Timeline with Forecasts on different days— created with Canva.com
When it Ended
We released the new version on April 25th, successfully closing a total of 63 items since March 22nd.
Generating Insights
How come the forecast was that much off — predicting the 9th of April when it ended up becoming the 25th of April? Do Monte Carlo Forecasts not work at all? Or is our algorithm broken? We sat down and analyzed the data we had to try to figure out what happened…
The Forecast Works, but…
The forecast on March 22nd predicted that we would close 29 items by the 9th of April. Inspecting the amount of actually closed items revealed that we closed 36. The forecast did predict quite accuratly how many items we’ll manage to close. The issue was that the forecast could not anticipate how many more items we’ll be adding due to the quality problems.
A funny meme — created with imgflip.com
Between March 22nd and April 25th, we’ve added 34 items (scope creep). Those were mainly quality-related items (read: bugs 🐞), so we could not have anticipated this (or could we? — more on this later). As a sanity check for our forecasts, we wanted to examine what the predictions would have been if we had possessed that information. That is, considering the scenario where we were aware of the need to address 63 items instead of 29.
We re-executed the Monte Carlo Simulation, simulating the conditions as of March 22nd and predicting the completion time for 63 items (29 remaining + 34 to be added). The Monte Carlo Simulation predicted a completion date of April 26th with an 85% confidence level (see screenshot below), while the actual completion occurred on April 25th.
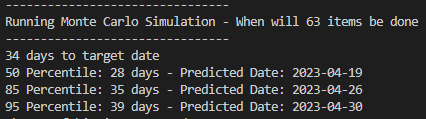
Predicted Target Date for the Release, 26th of April
So the forecast indeed works pretty accurately. So if you are reading this just to see how well Monte Carlo simulations perform, the answer is pretty well. Try it and see for yourself (and if you are like us, never look back at what you were using before).
We acknowledged that the main limitation in our forecast lies in its ability to predict based on the number of items we know we have to address in scope of a release. It becomes less effective when confronted with a significant influx of unplanned items, rendering its utility limited in such scenarios. Keep reading to see what we did to account for the unexpected.
Quality Issues
Too many unplanned items is a nice way of saying: the quality is subpar and we break too much stuff. Of those 34 items that were added over a bit over a month before release, 26 were bugs. So it’s not about having to change “the scope”, but it’s just a drop in quality that would degrade the user experience.

Unlike the bug in this picture, bugs in our Products don’t make us happy — Source: Freepik
It’s something to address. We have a lot of history in the product, and it is not always avoidable to break some things in the process of improving the code. That’s ok, we got to accept that. But not at that rate. At the same time, it’s the situation we are in, and it will not change overnight.
So we concluded that we should do the following things:
- Avoid Bugs: Find ways to improve over time so we don’t keep breaking things.
- Account for Bugs: Deal with the bugs in the forecast so we can still make use of it.
Both those points are important. Both of them will be addressed. But as we talk about forecasts in this post, we’ll be focusing on the latter going forward. It is essential to recognize the issue of product quality while simultaneously addressing the accuracy of our forecasts. Enhancing the product’s quality will inherently reduce the occurrence of unplanned work, such as bugs. However, it is unrealistic to expect an immediate resolution to this issue. Consequently, as we focused on enhancing product quality, we concurrently refined our forecasting methods to align with the dynamic nature of the product. The adopted approach has proven to be effective in managing these challenges.
Accounting for Bugs
So how could we account for bugs within our forecast? It’s not like we plan to create them, so they’ll always be unexpected. Also, we don’t want to simply ignore them, as we can’t degrade the quality for the customers. While brainstorming, the idea of running two forecasts came up, a dry forecast and a wet forecast.
Dry and Wet Forecasting
In music there is the concept of a dry signal (with no effect) and a wet signal (with effect). We were wondering if we could take our original forecast and apply some “effect” on it to account for the bugs that will appear. This should help support our decision-making, as we have a “best case” forecast (dry) and a “more likely case” (wet).

Dry and Wet signals — a concept known from Music — Source: Freepik
So much to the theory, but how exactly would we figure out how to adjust the original forecast? We still don’t know how many bugs we’ll be having…
From Hypothesis…
We might not know how many bugs we’re going to have, but we sure do know how many were created in the past. Our future will likely look like our past. That’s kind of how the whole Monte Carlo forecast thing works.
So we thought why not apply Monte Carlo forecasting to predict how many bugs we’ll be creating? This could then be added on top of the existing items we already know about and predict when we’ll be done.

Time for an Experiment! — Source: Freepik
To Experiment
To prove our hypothesis, we built a proof of concept version of our forecasting algorithm that:
- Used the bug inflow history
- Did a “how many” forecast with the bugs till a specific target date
- Predicted “when” a fixed backlog plus the added number of bugs would be done
We ran this algorithm with the data from the 22nd of March, and it predicted that:
- 36 bugs will be added till the 25th of April
- The bugs and planned items will be done on the 26th of April
That’s pretty close to the real release date.
Use it in the Real World
In real life, you don’t predict the past; you can’t precisely know a month in advance when you’ll finish everything as planned. If you could, forecasts wouldn’t be necessary, this post wouldn’t exist, and you’d probably be wondering why you’re reading this in the first place! I might start asking, ‘What’s your superpower? Predicting the past?’
Our goal was to get a good approximation to the real date and not to overfit the algorithm. So we tried the following:
- Based on the remaining items, predict when they will be done (dry forecast)
- Take this date, and predict how many bugs will appear in our backlog during this period
- Take that forecast of bugs added, sum it up with the known remaining items, and run another when prediction (wet forecast)
When we reran our simulation with this approach with the data from the 22nd of March, it predicted that we’ll be releasing on the 17th of April.
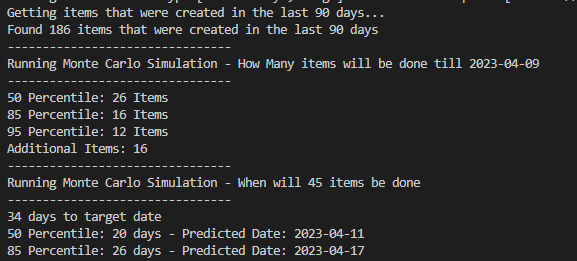
Prediction: 16 Bugs will be added, the Wet Forecast predicts to be done on 17th of April
This is not perfect, but that’s not the goal. We want a close enough approximation of what we can expect. And including the uncertainty of the bugs to be added will help us in making decisions.
Decide What to Do
So once our inspection was done and we had some findings, it was time to adapt a few things.
Extend our Forecasts
Once we saw how much better the wet forecasts worked, we of course wanted to use them. Not instead of the dry ones, but in parallel. This should help us see different scenarios that could happen.
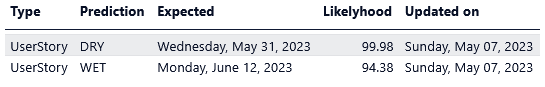
Dry and Wet forecasts
This helps us a team and the PO specifically to make decisions and take actions.
Visualize the History of Forecasts
The exercise of going through the old forecasts was very interesting and helped us dig deeper into what happened. But it was a bit cumbersome to do so as we did not store the old forecasts but just had “the latest one” available. So going forward we want to keep the old ones and also visualize them. This should help if we want to spot patterns, analyze what happened, or just want to use it in a retrospective.
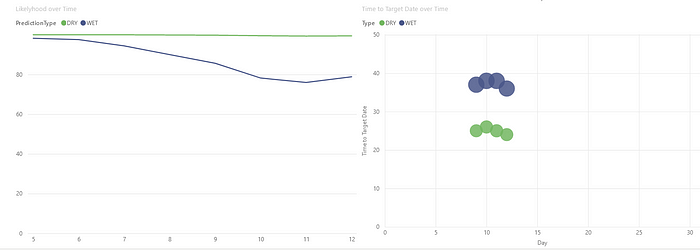
Visualizing “Likelihood to hit the Target Date” and “Time till forecasted release” over time
Get Quality under Control
Having too many bugs is not a state we can and should accept. This is something to be worked on and improved upon. In an ideal world, we would not need another type of forecast. And over time we should get better and both forecasts should converge.
Conclusion
Our data showed that the Monte Carlo forecasts work. They predict very well when a certain amount of items will be done. But they are not able to predict the future.

Don’t forget, Forecasts are not able to predict the future —Image generated with imgflip.com
If you have an unstable system where many new things appear, a forecast for a fixed amount of items will not be able to help you. However, Monte Carlo simulations can also be used to predict how many items will be added in a certain amount of time.
When working in agile setups, we should reflect on a regular base.
At regular intervals, the team reflects on how to become more effective, then tunes and adjusts its behavior accordingly. — Principle from the Agile Manifesto